Louis-Victor Jadavji (or "LV") is a recognized leader in the cloud services industry. He's helped 50+ digital native companies like ModusBox, Later, and NS1 choose the right cloud stack for their applications. His work has been featured in Forbes (30 Under 30 All-Star), HuffPost, The New York Times, The Globe and Mail, and Inc. Magazine.
Kubernetes, also known as K8s, is a container orchestration engine built by Google to manage their container deployments and released as open-source in 2014. It automates the deployment, scaling, and management of containerized applications.
Kubernetes helps enterprises speed up their development and deployment processes and efficiently utilize resources. However, Kubernetes is a very large, complex distributed system with many components to monitor and manage.
Ops teams can monitor Kubernetes with the help of open-source monitoring tools such as Prometheus, Jaeger, Grafana, etc., and vendor-provided tools such as AppDynamics, Datadog, and Instana.
Enterprises used to run multiple applications on the same physical servers, causing resource allocation problems. One application would take up most of the resources, causing performance issues for other applications. In addition, running multiple applications on a single server did not work for the applications that had to meet specific compliance standards. Organizations used to run applications on different physical servers, which could lead to underutilized resources.
Virtualization allowed multiple Virtual Machines (VMs) to run on a single physical server and solve these issues. As a result, boundaries were created between applications wherein another application does not freely access information of one application, and applications can be added or updated easily, reducing hardware costs and increasing scalability. Containers were introduced to share resources but have separate file systems.
Benefits of Containers
Agility: Agile methodology is possible as changes to the application can be made by multiple teams/resources simultaneously and quickly.
Portability: As containers have separate software, libraries, memory, configuration, etc., they are portable and deployable on different OS and hardware platforms.
Consistency: Containerization helps applications run in different environments in the same manner.
Faster CI/CD: Containerization helps you rapidly develop and deploy applications.
Efficiency: Containerization helps you utilize the infrastructure resources more efficiently than traditional monolith architecture.
Why Kubernetes?
In a microservices-first world, enterprises tend to deploy large applications in multiple containers that run across multiple clusters. Coordinating these containers and virtual machines is complex in large distributed applications.
Kubernetes is an open-source container orchestration software. It controls how to run containers and where to run them. It helps run containers and workloads by tackling operational complexities such as scaling up or scaling down different containers and the virtual machines on which the containers are deployed. The basic functional unit of Kubernetes is called a “pod,” and containers are grouped into these pods. Containers and pods can be scaled up or down to the desired state. In addition, the lifecycle is managed to keep the applications up and running.
Benefits of Kubernetes
Scalability: With the help of configuration management tools in Kubernetes, it’s easy to scale the containers and the clusters on which they are running.
Efficiency: Kubernetes helps you use resources efficiently by automating the distribution of applications across different clusters.
High Availability: Kubernetes helps you restart failed containers or replace them by killing them when they don’t respond to user-defined health checks and helps you maintain a highly available service.
Speed and Agility: Kubernetes provides a way to potentially orchestrate and manage container resources from a single control plane, thereby keeping the core promise of containers: speed and agility.
Load Balancing: Kubernetes can distribute the incoming traffic by exposing a container using either the DNS name or IP address, thereby balancing the load.
Components of Kubernetes
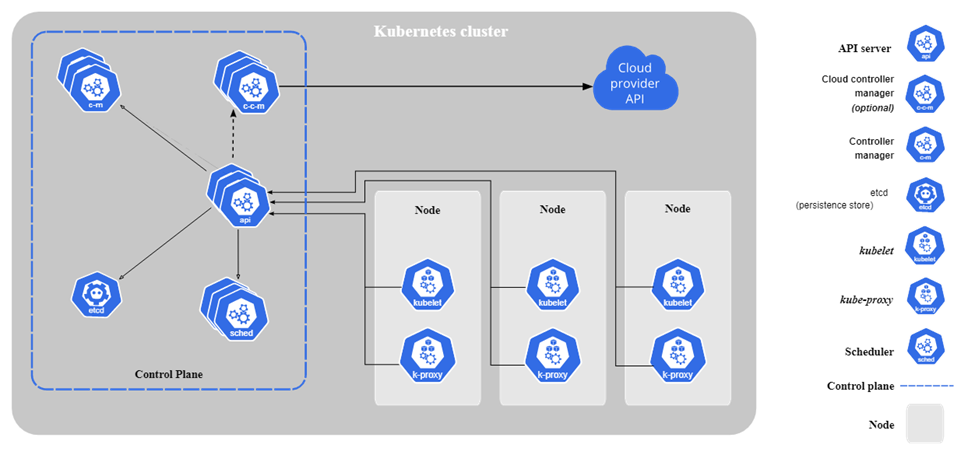
Kubernetes clusters contain the following three components:
Nodes: A set of worker machines that run containerized applications.
Pods: A group of containers running on worker nodes.
Control Plane: Manages worker nodes and pods in the cluster.
Control Plane Components
Let’s dive in a bit deeper into the components of the control plane:
kube-apiserver: The API server is the front-end for the Kubernetes control plane that exposes the Kubernetes API. kube-apiserver can scale horizontally by deploying more instances. Several instances of kube-apiserver can be run, and load can be balanced between those instances.
etcd: A consistent and highly available key-value store. It is used as Kubernetes’ backing store for all cluster data.
kube-scheduler: Watches for newly created pods with no assigned node and assigns a node in such instances.
kube-controller-manager: Controller that runs processes depending on the type:
Node Controller: Responsible for noticing and responding when nodes go down.
Job Controller: Creates pods to run tasks to completion by watching for job objects that represent one-off tasks.
Endpoint Controller: Populates endpoint object (joins services and pods).
Service Account & Token Controller(s): Creates default accounts and API access tokens for new namespaces.
Cloud-controller manager: Runs only controllers specific to the cloud provider and of the following types:
Node controller: Checks the cloud provider to determine if a node has been deleted in the cloud after it stops responding.
Route controller: Sets up routes in the cloud infrastructure.
Service controller: Creates, updates, and deletes load balancers provided by a cloud provider.
Node components
Nodes have the following components:
Kubelet: An agent that runs on each node in the cluster. It makes sure that containers are running in a pod.
Kube-proxy: A network proxy that runs on each node in the cluster.
Container runtime: Software responsible for running containers.
There are several tools in the market that provide monitoring applications that run on the Kubernetes cluster. Below are some of the open-source tools and vendor-provided tools.
Open-Source Monitoring Tools
Kubernetes Dashboard
Kubernetes dashboard is a web-based Kubernetes user interface. The dashboard can be used to deploy containerized applications to a Kubernetes cluster.
Troubleshoots containerized applications and manages the cluster resources.
Provides an overview of applications that are running on the Kubernetes cluster.
Used to create and modify individual Kubernetes resources such as Deployments, Jobs, DaemonSets, etc.
Easy to install as a component of the Kubernetes environment
Has limited monitoring features.
Elastic Stack
The Elastic Stack (also known as “ELK Stack”) is a popular collection of four open-source log management and monitoring solutions – Elasticsearch, Logstash, Kibana, and Beats. It is used for Kubernetes monitoring as well.
Full-text search and analytics engine where Kubernetes logs can be stored.
Log aggregation that collects and processes logs before sending them to Elasticsearch.
Nice dashboards. (Kibana)
Automatically send logs and metrics from different machines and systems to Logstash or Elasticsearch.
Jaeger
Jaeger is an open-source distributed tracing system inspired by Dapper and OpenZipkin that was developed by Uber.
Monitors and troubleshoots microservices-based distributed systems.
Provides distributed context propagation, transaction monitoring, service dependency analysis, root cause analysis, and performance or latency optimization.
Prometheus
Prometheus was originally built at SoundCloud in 2012 before being released as an open-source project. It joined CNCF as only the second hosted project after Kubernetes.
Offers powerful queries with custom query language PromQL that allows slicing and dicing the collected time-series data to generate visualizations and alerts.
Designed to monitor applications and microservices running in containers at scale.
Prometheus is not a great visualization tool, but it integrates with many tools such as Grafana, which provides dashboards.
Grafana
Grafana offers open-source software that allows you to query, visualize, alert, and explore metrics, logs, and traces from different systems.
Commonly used for monitoring Kubernetes clusters and provides dashboards to monitor and visualize the Cluster, Node, Pod/Container, and Deployment levels.
Provides multiple graphs such as bar charts, Geo maps, heat maps, histograms, etc.
Integrates with tools such as Graphite, Influx DB, and Prometheus to create information-rich dashboards.
Vendor-provided Tools
Datadog
Datadog is an Application Performance Monitoring tool (or “APM” for short) that gives visibility into Kubernetes applications by monitoring, troubleshooting, and optimizing application performance.
Enables users to collect and visualize front-end and back-end data in a single pane of glass.
Provides graphs and alerts on error rates or latencies.
Provides end-to-end distributed tracing ability.
Provides tracing of outliers for faster root cause analysis.
Provides automatic code analysis with actionable insights and a low overhead for code profiling.
Easy to install but has complex log integration.
Dynatrace
Dynatrace provides APM tooling by supporting multiple languages, application architectures, cloud, on-premises or hybrid, enterprise applications, SaaS monitoring, etc.
Provides real-time visibility into dynamic microservices environments.
Automatically discovers and monitors dynamic microservice workloads running inside containers on Kubernetes.
Provides all relationships and dependencies across all components in the system.
Automatically monitors cloud-native workloads and microservices.
Ops teams can see how microservices are performing and how they communicate with each other and immediately detect poorly performing microservices.
Easy to install but has a very steep learning curve.
NewRelic
New Relic is an APM tool that features Kubernetes integration and provides visibility to performance across the entire application environment.
Automatic instrumentation for different programming languages such as GO, PHP, Node, Python, Java, Ruby, .NET, C++, and many frameworks.
Shows application health and performance.
Shows transaction time, errors, and throughput in the form of dashboards
Service maps show dependencies between services for Ops teams to see how everything works together.
Captures and analyzes all traces and visualizes the most actionable data, including performance changes during deployments.
Complex onboarding.
AppDynamics
AppDynamics APM by Cisco provides a global view across the application landscape that runs on a container or Kubernetes cluster.
Agents are deployed throughout the environment and help discover individual business transactions, from which a complete view of application topology is created across public cloud, private cloud on-premises, and hybrid environments.
Agents send detailed performance and business metrics from different application components running on the Kubernetes cluster back to a central AppDynamics controller using ML, creating a dynamic baseline for each metric.
Transaction snapshots are captured down to the individual line of code.
Instana
Instana provides Kubernetes and container monitoring.
Continuously discovers and maps all services and monitors all application dependencies.
Traces each request, ingests metrics, and profiles all processes.
Provides immediate contextual information about the quality of every service and improves application performance.
Resolves issues faster with intelligent actions.
Provides real-time stream processing for collecting and analyzing telemetry data.
Automatically shows anomalies in the events.
Provides immediate and automated feedback on whether to conduct a rollback after a deployment.
Looking for a new solution?
Get a detailed requirements table and filter solutions for your exact use case using our platform.
By clicking “Accept All Cookies”, you agree to the storing of cookies on your device to enhance site navigation, analyze site usage and assist in our marketing efforts. More info
By clicking “Accept All Cookies”, you agree to the storing of cookies on your device to enhance site navigation, analyze site usage and assist in our marketing efforts. More info