Louis-Victor Jadavji (or "LV") is a recognized leader in the cloud services industry. He's helped 50+ digital native companies like ModusBox, Later, and NS1 choose the right cloud stack for their applications. His work has been featured in Forbes (30 Under 30 All-Star), HuffPost, The New York Times, The Globe and Mail, and Inc. Magazine.
Observability is an end-to-end framework for:
You need logs, traces, and metrics from all system components to make systems observable. Telemetry data is mainly logs, traces, and metrics. These three are called the Pillars of Observability. Many open-source tools provide end-to-end observability either by using a single tool or combining multiple tools based on the type of architectures and systems in use.
There are many open-source observability tools, which we cover in-depth this other post. Below are some of the vendor-provided observability tools.
Datadog provides Observability Pipelines in addition to APM and other types of monitoring to provide a complete picture for different connected services and the appropriate troubleshooting tools irrespective of whether the issues are related to the database, infrastructure, etc.
Key Features of Datadog’s Observability Pipelines:
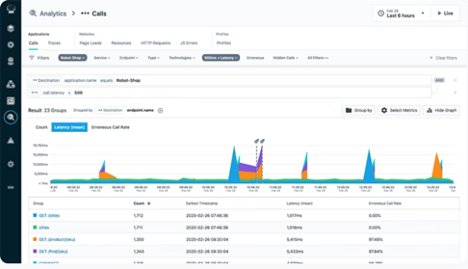
New Relic provides cross-platform observability and all telemetry data can be ingested with their native support for Open Telemetry. In addition to Application Performance Monitoring (APM), New Relic offers Infrastructure Monitoring, Kubernetes Monitoring with Pixie, Log Management, Network Performance Monitoring, Real User Monitoring (i.e., RUM metrics), Vulnerability Management, Machine Learning Model Performance Monitoring, etc. With the wide variety of monitoring and management tools that New Relic offers, it’s possible to correlate issues across the stack for more actionable insights.
Key Features of New Relic:
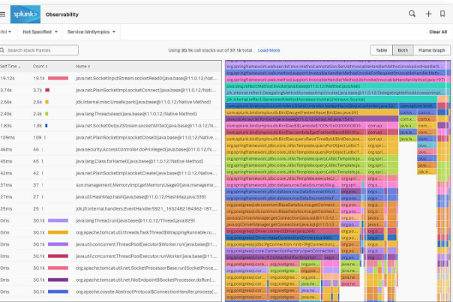
Splunk provides end-to-end Observability for organizations with a suite of products, such as Splunk APM, Splunk Infrastructure Monitoring, Splunk IT Service Intelligence, Splunk Log Observer, Splunk Real User Monitoring, Splunk Synthetic Monitoring, and Splunk On-call for incident management.
Key features of Splunk Observability Suite:
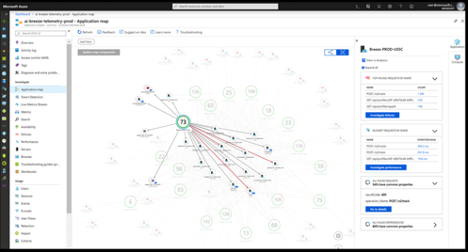
Dynatrace provides observability for apps and infrastructure across hybrid and multi-cloud environments and is especially well-suited for enterprise implementations and scale. Its AI engine provides causation-based answers and proactive, actionable insights. It provides a complete view of transactions by bringing together real user monitoring, synthetic monitoring, and session replay. Dynatrace offers different services such as Infrastructure Monitoring, Applications and Microservices, Application Security, Digital Experience, Business Analytics, and Cloud Automation to achieve end-to-end observability.
Features of Dynatrace Observability:
Azure Monitor has multiple features that help enterprises increase the availability and performance of applications and services. The Application Insights feature in Azure Monitor supports distributed tracing through OpenTelemetry. In addition to APM, it provides Infrastructure Monitoring, Container Monitoring, VM monitoring, etc., and good dashboarding for Ops teams to monitor and find issues.
Key features of Azure Monitor:
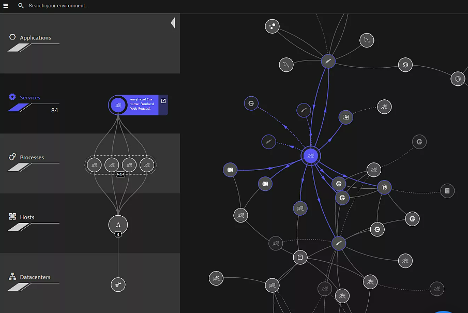
Instana provides an enterprise observability platform by ingesting all performance metrics, tracing all requests, and profiling all processes to make observability work and provide full contextual. In addition to APM, Instana also provides Kubernetes or Microservices Monitoring, End-User Monitoring, Serverless Monitoring, Cloud and Infrastructure Monitoring, Website Monitoring, etc.
Key features of Instana's Enterprise Observability platform:
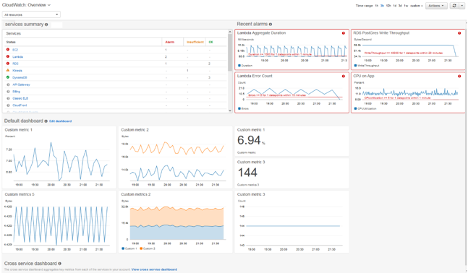
Amazon CloudWatch provides visibility into cloud resources and applications. It can collect metrics and logs from all AWS resources, applications, and services that run on AWS and on-prem servers. With CloudWatch, you can analyze user requests to speed up troubleshooting and debug. CloudWatch Dashboards provide visualizations that correlate logs, traces, and metrics, and there are alarms or automated responses that can be set for threshold changes. CloudWatch ServiceLens ties together metrics, logs and traces from AWS X-Ray to provide end-to-end observability.
Key features of Amazon CloudWatch:
AppDynamics, along with other products of Cisco such as ThousandEyes and Intersight, provides full-stack observability. It provides modern cloud-native application monitoring and hybrid application monitoring. AppDynamics helps with cost optimization by providing visibility into resource allocation, simplifies vulnerability management, and can defend applications against exploits.
Key features of AppDynamics Observability: