Open Source and Free Observability Tools

Louis-Victor Jadavji
September 6, 2022
Louis-Victor Jadavji, Cofounder of Taloflow

Louis-Victor Jadavji (or "LV") is a recognized leader in the cloud services industry. He's helped 50+ digital native companies like ModusBox, Later, and NS1 choose the right cloud stack for their applications. His work has been featured in Forbes (30 Under 30 All-Star), HuffPost, The New York Times, The Globe and Mail, and Inc. Magazine.

Observability is an end-to-end framework for collecting telemetry data, such as logs, traces, metrics, events, etc., at both the infrastructure and application levels, then processing, analyzing, and visualizing that information to find issues and understand why they occur.

To make a system observable, you need telemetry data from all system components consisting mainly of logs, traces, and metrics.

There are many open-source and vendor-provided observability tools. Below are some of the open-source observability tools.

Get a report on the best APM and Observability provider. Tailored to your exact use case.
Get My Free Observability Evaluation
It takes 5 minutes

Elastic

GitHub: https://github.com/elastic

Nowadays, it’s common for companies to have distributed systems. All observability data should be in one stack to monitor these systems and gain insights effectively, which Elastic Observability (built on the popular ELK stack) makes possible. By bringing the application, infrastructure, and user data into a unified solution, silos converge.

Key features of Elastic Observability:

  • Collects and transforms data, and also provides visualizations to find the root cause.
  • Highly available and scalable.
  • Supports full-stack monitoring.
  • Supports full-text search.
  • Provides data visualizations and dashboards for drill-down, filtering, querying, etc.
  • Can send alerts and notifications.
  • Can ingest all telemetry data (metrics, logs, and traces) from any source.
Source: Elastic

OpenTelemetry

GitHub: https://github.com/open-telemetry

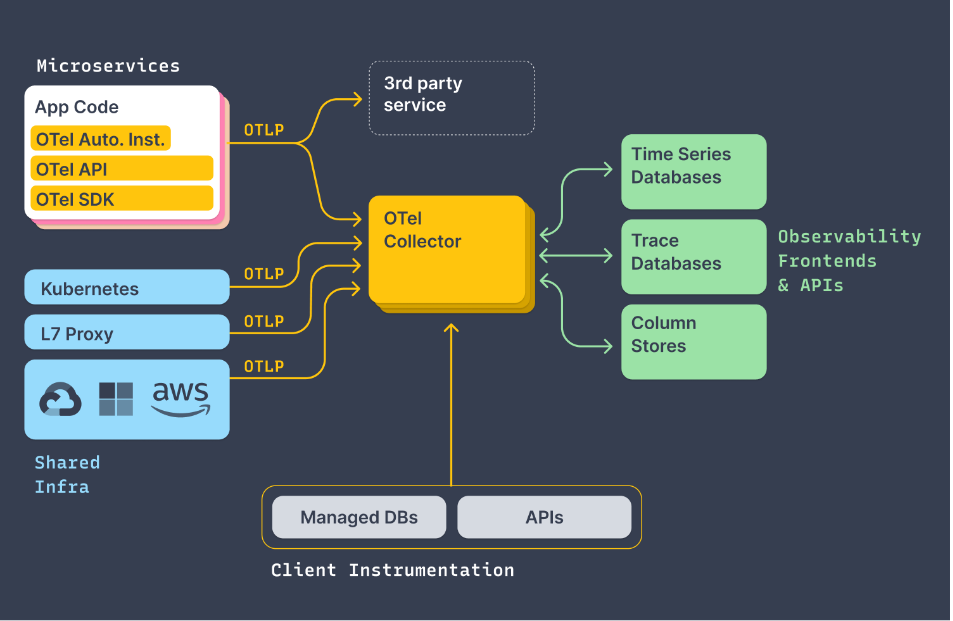
OpenTelemetry (OTEL) is an open-source observability framework sponsored by the CNCF (Cloud Native Computing Foundation) that was formed by merging the OpenTracing and OpenCensus projects. OpenTelemetry does not provide an observable back-end. It’s up to the Ops team to export data to one of the many available analytical tools. OpenTelemetry helps developers and Ops teams by providing pluggable architecture so that formats and additional protocols can be added easily.

The components of OpenTelemetry are listed below:

  • The API defines the data types and operations for generating and correlating telemetry data such as tracing, metrics, and logs.
  • The SDK defines the configuration, data processing, exporting concepts, and requirements for implementing a language-specific API. 
  • The Collector receives, processes, and exports telemetry data. It requires a backend to receive and store the telemetry data in multiple formats, such as OTLP (Open Telemetry Protocol), Prometheus, Jaeger, etc., and consists of:
  • Receivers that receive data (push or pull-based).
  • Processors that process the received data.
  • Exporters that export/send the data (push or pull-based). 

Key features of OpenTelemetry:

  • It helps collect telemetry data such as logs, metrics, and traces from different components.
  • It forwards the telemetry data to various tools for analyzing the performance and behavior of components.
  • It supports many modern programming languages such as Java, .Net, C++, Golang, Python, Node.js, PHP, Ruby, Rust, Swift, Erlang, NestJS, etc.
Source: OpenTelemetry

Apache Skywalking

GitHub: https://github.com/apache/skywalking

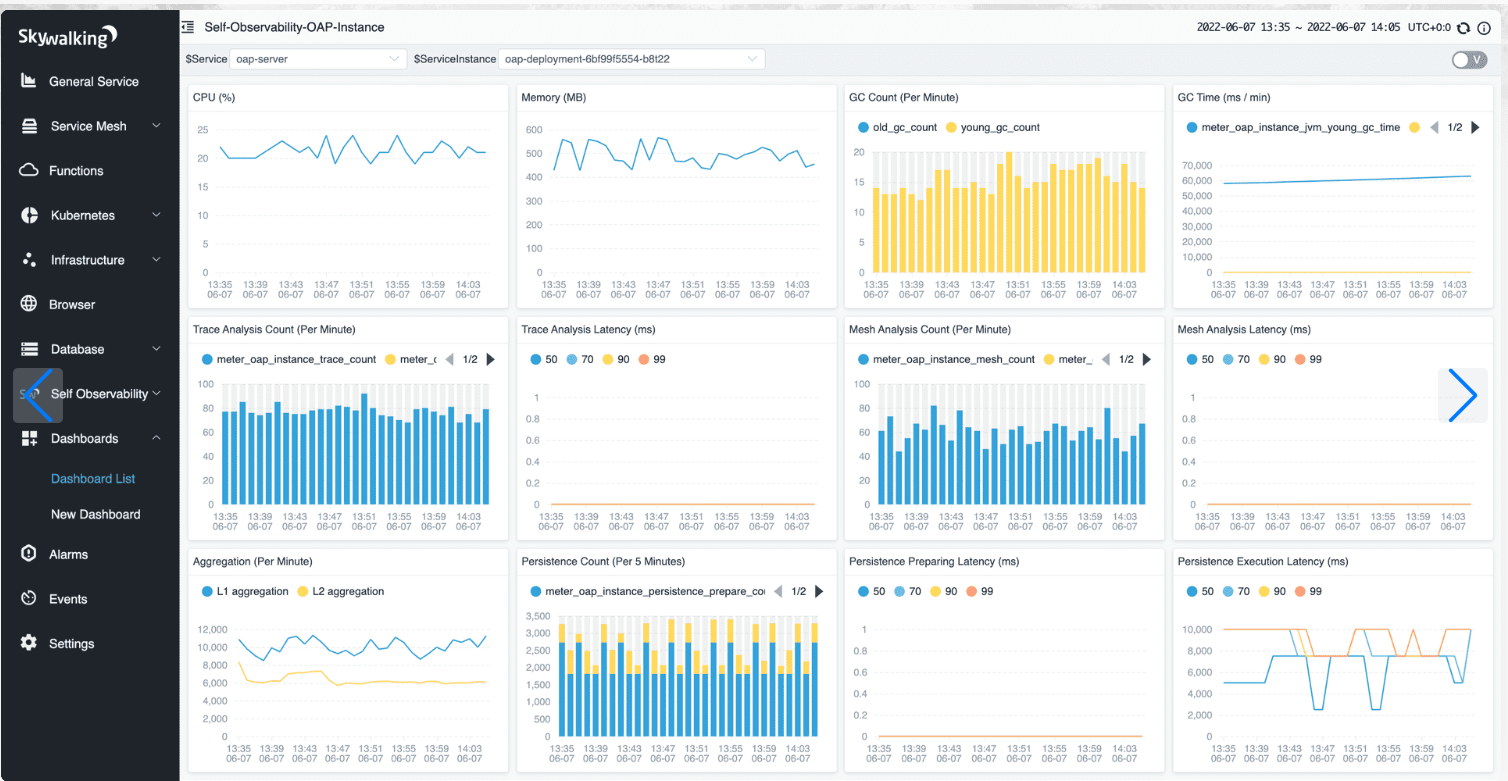
Apache Skywalking is one of the most popular open-source tools to provide both Application Performance Monitoring (APM) and Observability capabilities. It is designed for distributed systems, microservices, cloud-native and container-based or Kubernetes architectures. It supports the three pillars of observability (Logs, Metrics, and Traces) by collecting data from multiple sources, formats, and programming languages such as Java, .NET Core, NodeJS, PHP, Python, Golang, C++, etc.

Skywalking OAP (Observability Analysis Platform) uses STAM (the Streaming Topology Analysis Method) to analyze the topology for better performance in the tracing-based agent scenario.

 Key features of Skywalking:

  • Root cause analysis and code profiling on runtime by in-process agent and EBPF profiler.
  • Slow services and endpoint detection.
  • Distributed tracing and context propagation.
  • Topology mapping and analysis.
  • Service, service instance, and endpoint metrics analysis.
  • Database access metrics for detecting slow database access statements.
  • Browser performance monitoring and infrastructure monitoring.
  • Built-in data visualization with the ability to customize.
  • Provides native agents and works with tools to support all stack monitoring.
  • Supports a wide range of pluggable backend solutions.
Source: Apache Skywalking

inspectIT Ocelot

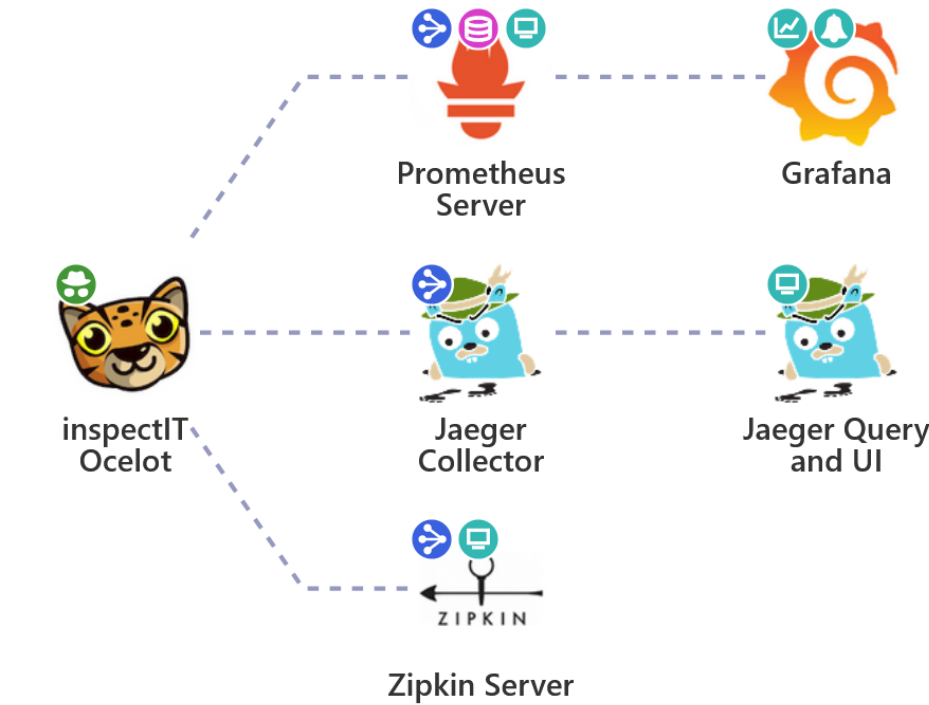
GitHub: https://github.com/inspectIT/inspectit-ocelot

inspectIT Ocelot agent is a zero-configuration Java agent that collects application performance, tracing, and business data. It unlocks observability for Java monitoring. The agent uses Java byte-code manipulation to set up the OpenCensus instrumentation library with zero configuration and no changes in source code. inspectIT Ocelot supports multiple exporters for Java such as Prometheus, Zipkin, Jaeger, etc. that OpenCensus offers. It can be integrated with APM tools such as Grafana to get great visualizations and dashboards to visualize the data. 

Key Features of inspectIT Ocelot:

  • Distributed tracing that tracks and analyzes requests through all the systems. 
  • Collects different kinds of metrics and visualize them.
  • Analyzes the interconnections of services and applications.
  • Adding, modifying, and removing an agent's data collection logic can be done dynamically.
  • The agent can be attached, upgraded, and removed during runtime without restart.
  • Using open standards, it can be integrated with a variety of proven tools.
Source: inspectIT Ocelot

Vector

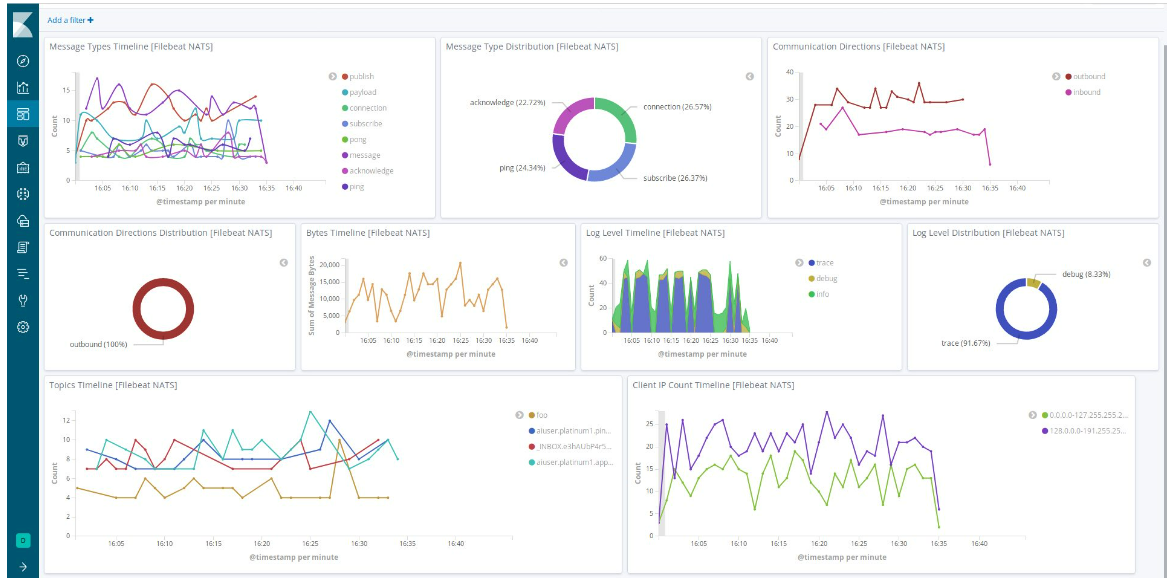
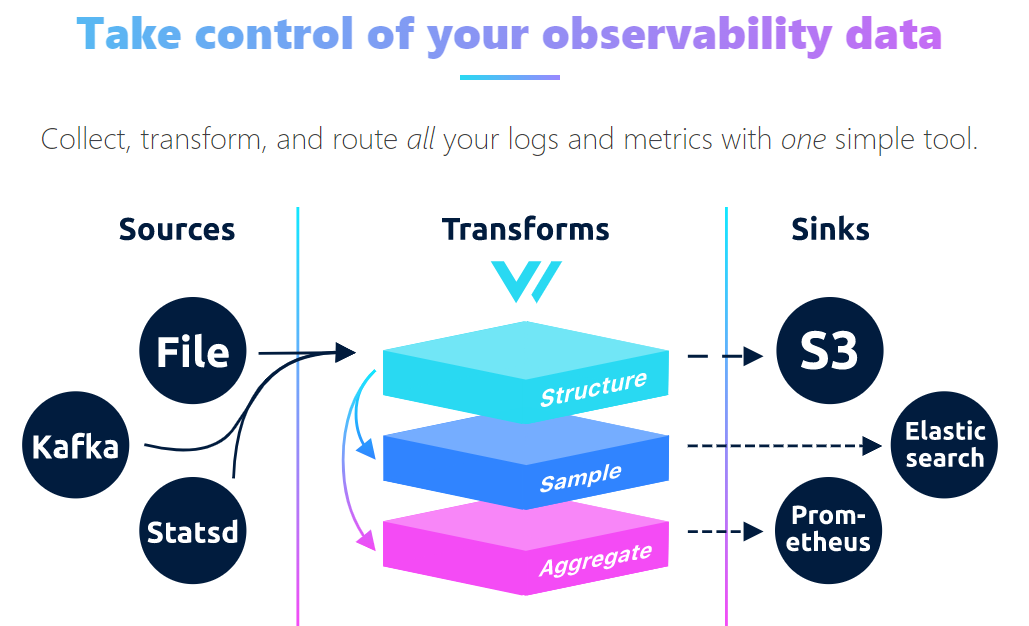
GitHub: https://github.com/vectordotdev/vector

Vector is an open-source observability data platform that allows users to collect and transform all the logs, metrics, and traces from on-premises and cloud environments. It then routes them to any open-source or vendor-provided tool and allows users to control how data moves through the pipeline, cost control, and compliance management. In addition, it helps users manage how the telemetry data is ingested, enriched, stored, and routed to build cost-efficient yet fully capable data pipelines in the cloud and on-prem environments. Datadog acquired Timber Technologies, the company behind Vector, in 2021.

Vector has the following components:

  • Sources define where Vector should pull the data from or how the data is pushed to Vector. Examples of sources include file, Syslog, statsd, and stdin. A topology can have multiple sources; when data is ingested, it is normalized into events.
  • Transforms for transforming events with parsing, filtering, sampling, aggregating, etc.
  • Sinks as a destination for events with downstream services defining the sink's design and transmission method. For example, the socket sink streams individual events, whereas the aws_s3 sink buffers and flushes data.

Key features of Vector:

  • It is very reliable.
  • It is a complete platform that deploys as an agent or aggregator.
  • It is a single tool that collects logs, metrics, and traces.
  • Reduces total observability costs.
  • Makes transitioning vendors without disrupting workflows possible.
Source: Vector

SigNoz

GitHub: https://github.com/SigNoz/signoz

SigNoz is an open-source observability tool that provides metrics monitoring and distributed tracing and natively supports OpenTelemetry. In addition, SigNoz provides visualizations for traces and metrics data.

Below are the components of SigNoz:

  • The OpenTelemetry Collector can receive data in multiple formats and currently has receivers for Jaeger, Kafka, OpenCensus, OTLP, and Zipkin.
  • ClickHouse: The OTEL Collector writes data to ClickHouse. 
  • Query Service: The interface between ClickHouse and the front-end. It queries ClickHouse, fetches the data, processes it, and sends it to the front-end.
  • User interface built in ReactJS and Typescript.

Key features of SigNoz:

  • It has a scalable and modular architecture to handle enterprise scale. 
  • Native support for OpenTelemetry, which is an emerging industry standard for instrumentation.
  • Built on a modern stack (Golang and React).
  • Usage can be monitored, and the retention period can be set.
  • Integrated UI for metrics and traces.
  • Filter advanced traces and drill down into traces to analyze and resolve issues. 
Source: SigNoz

Jaeger

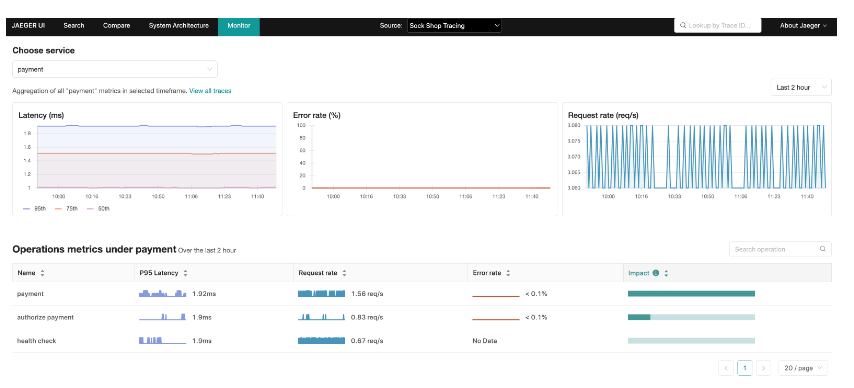
GitHub: https://github.com/jaegertracing/jaeger

Jaeger is an open-source distributed tracing system developed by Uber, inspired by Dapper and OpenZipkin. It is used for monitoring, and troubleshooting microservices-based distributed systems and provides distributed context propagation, transaction monitoring, service dependency analysis, root cause analysis, and performance or latency optimization.

Jaeger’s components are listed below:

  • The agent listens for spans sent over UDP, which are then batched and sent to the collector. The agent is not required if your application is instrumented with OpenTelemetry. It can forward the trace data directly to the Collector.
  • The Collector receives the data from SDKs or agents, processes it, and stores it.
  • Query: The service exposes APIs for fetching data from storage and has a UI that enables searching and analyzing traces.
  • Ingester: The service reads traces from Kafka and writes them to the storage backend.

Key features of Jaeger:

  • The backend is designed to have no single point of failure.
  • Provides native support for OpenTracing and OpenTelemetry.
  • Supports open-source NoSQL databases, Cassandra, and Elasticsearch as trace storage backends.
  • The UI supports two types of service graphs, such as the System Architecture and Deep Dependency Graph.
  • Its web UI is implemented in Javascript using popular open-source frameworks like React.
  • Provides Service Performance Monitoring.
Source: Jaeger

Zipkin

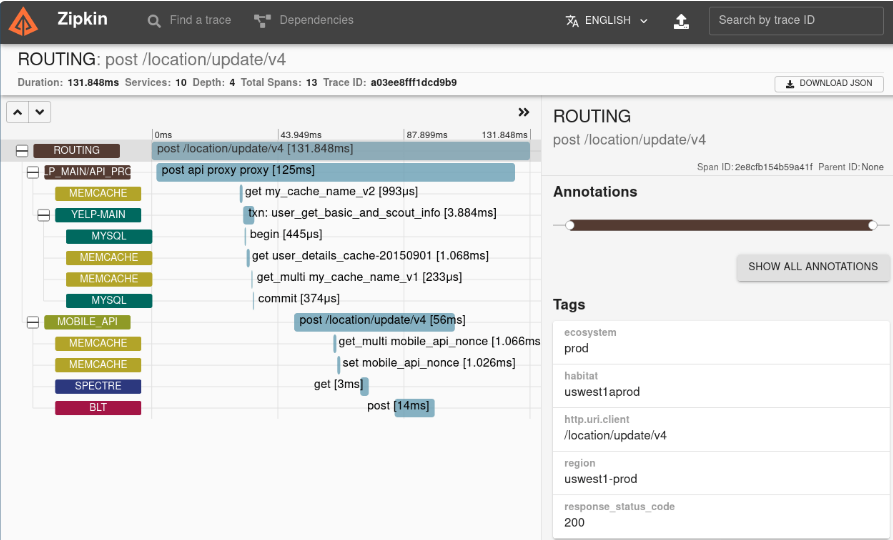
GitHub: https://github.com/openzipkin/zipkin

Zipkin is an open-source distributed tracing system originally developed by Twitter. Zipkin, at its core, is a Java-based application that provides several services that can collect and look up data from distributed systems. It also gathers the timing data needed to troubleshoot any problems when incidents occur.

Below are the components of Zipkin:

  • Zipkin Collector: Trace data is validated, stored, and indexed for lookups by the collector once data arrives at the collector.
  • Storage: Supported databases for storing data are Cassandra, ElasticSearch, MySQL, etc.
  • Zipkin Query Service: Data in storage can be fetched with this query service and then sent to Web UI to render graphs.
  • Web UI: This is the UI that shows traces based on service, time, and annotations.

Key Features of Zipkin:

  • Zipkin supports OpenTracing, OpenCensus, and OpenTelemetry.
  • It has a wide range of extensibility options and many tooling integrations.
  • It is a good fit for enterprise environments.
  • It checks the traces of application logs and helps monitor the application's latency.
Source: Zipkin
Get a report on the best APM and Observability provider. Tailored to your exact use case.
Get My Free Observability Evaluation
It takes 5 minutes
shapes
hide

Comparing observability tools?

Get a detailed requirements table and filter solutions for your exact use case using our platform.