Louis-Victor Jadavji (or "LV") is a recognized leader in the cloud services industry. He's helped 50+ digital native companies like ModusBox, Later, and NS1 choose the right cloud stack for their applications. His work has been featured in Forbes (30 Under 30 All-Star), HuffPost, The New York Times, The Globe and Mail, and Inc. Magazine.
Because of the complexity and variety of data sources we see in modern microservices-based architectures, it is becoming more difficult to understand the underlying cause of problems. Application Performance Monitoring or Application Performance Management (APM) helps organizations collect, process, and visualize the telemetry data from different systems to troubleshoot issues faster.
There are many open-source and vendor-provided APM tools. Below we cover some of the open-source APM tools worth looking at.
GitHub: https://github.com/prometheus
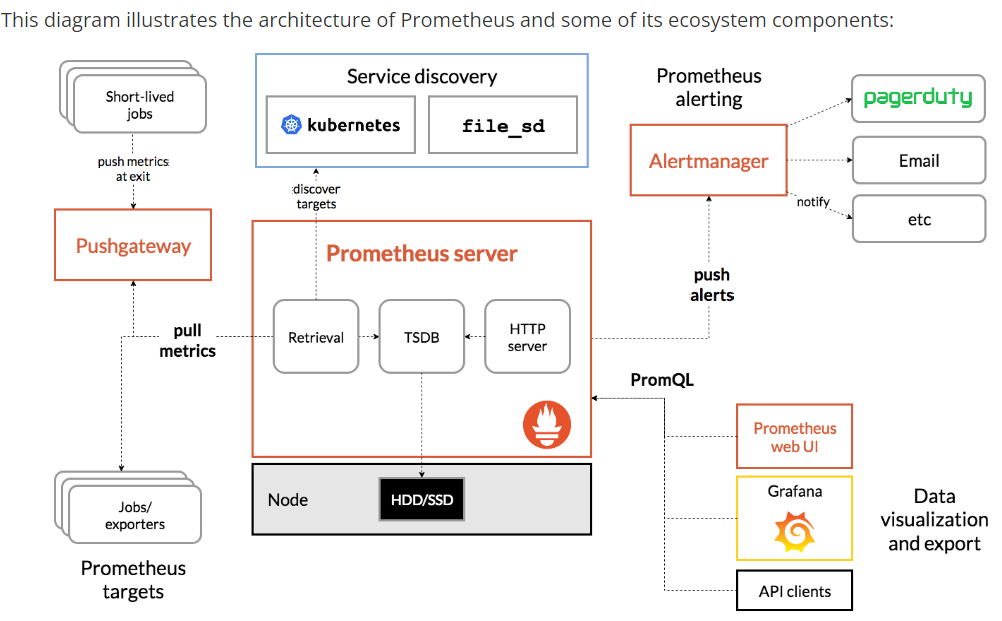
Prometheus was originally built at SoundCloud in 2012 before being released as an open-source project. It joined the Cloud Native Computing Foundation (CNCF) as the second hosted project after Kubernetes.
Prometheus has multiple components:
Key features of Prometheus:
GitHub: https://github.com/pinpoint-apm/pinpoint
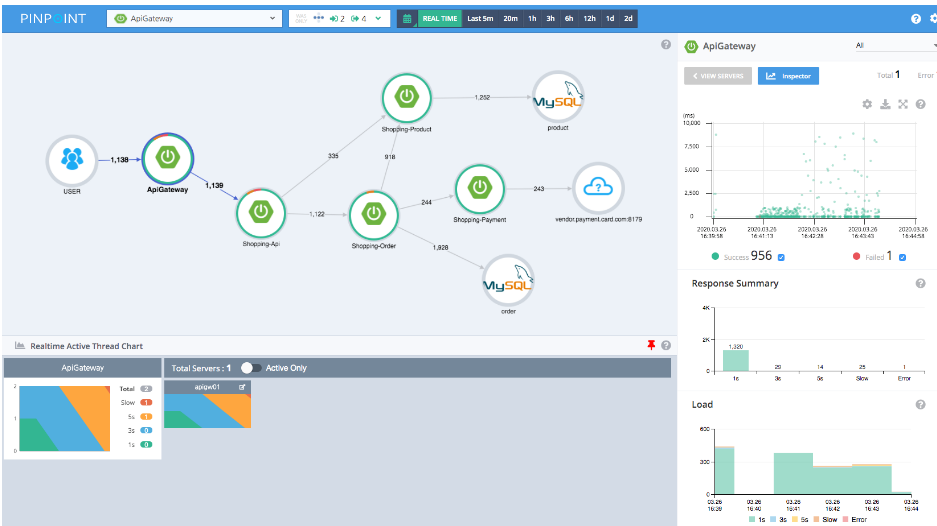
Pinpoint is an APM tool for large-scale distributed systems written in Java/PHP/Python, inspired by Google's Dapper. It traces transactions across distributed applications and analyzes the overall structure of the systems and the interconnections of components within them.
Pinpoint has multiple components:
Key features of Pinpoint:
GitHub: https://github.com/stagemonitor/stagemonitor
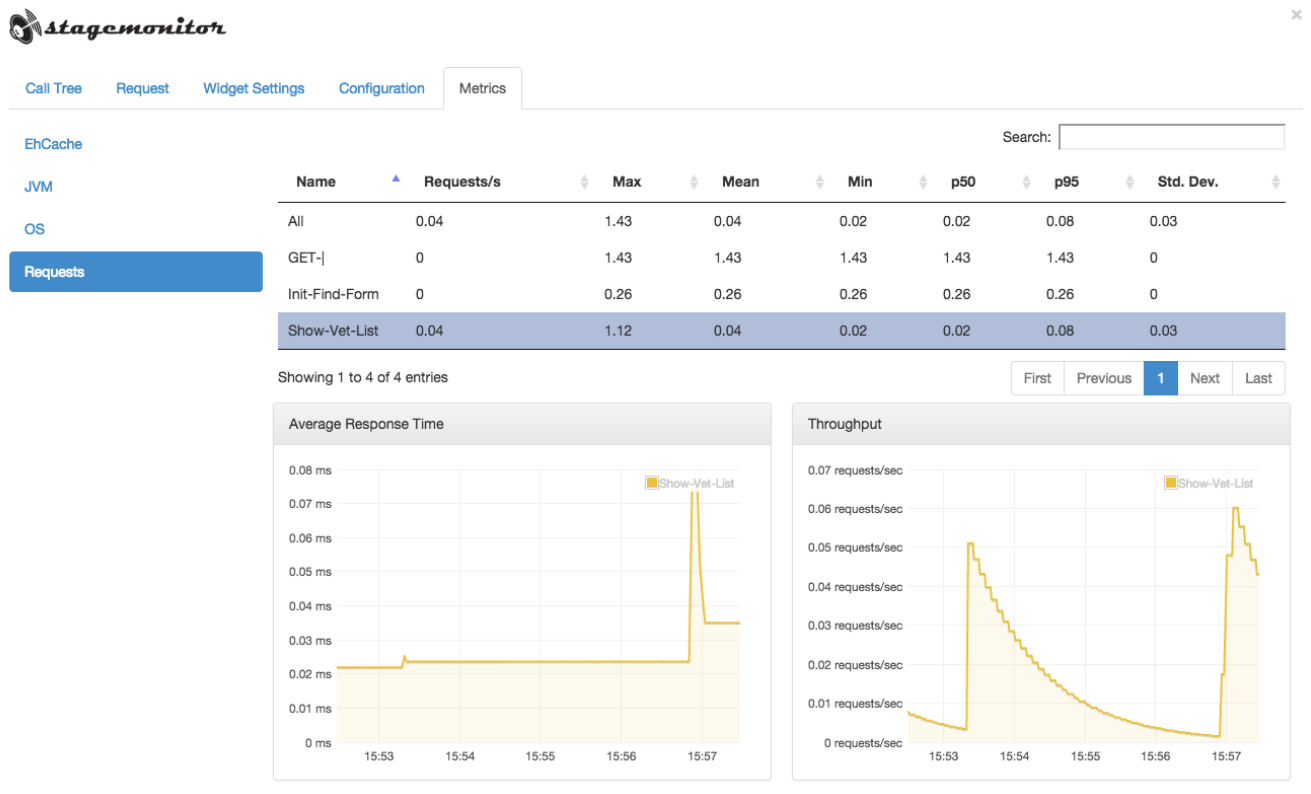
Stagemonitor is an open-source APM tool designed for Java server applications. It can be deployed in a data center, and private mode can be turned on for added security. It integrates with tools such as Graphite, InfluxDB, and Elasticsearch for graphed metrics analysis and integrates with Kibana for analyzing requests and call stacks. It has pre-configured Grafana and Kibana dashboards and is very customizable.
Stagemonitor has multiple components:
Key features of Stagemonitor:
GitHub: https://github.com/scouter-project/scouter
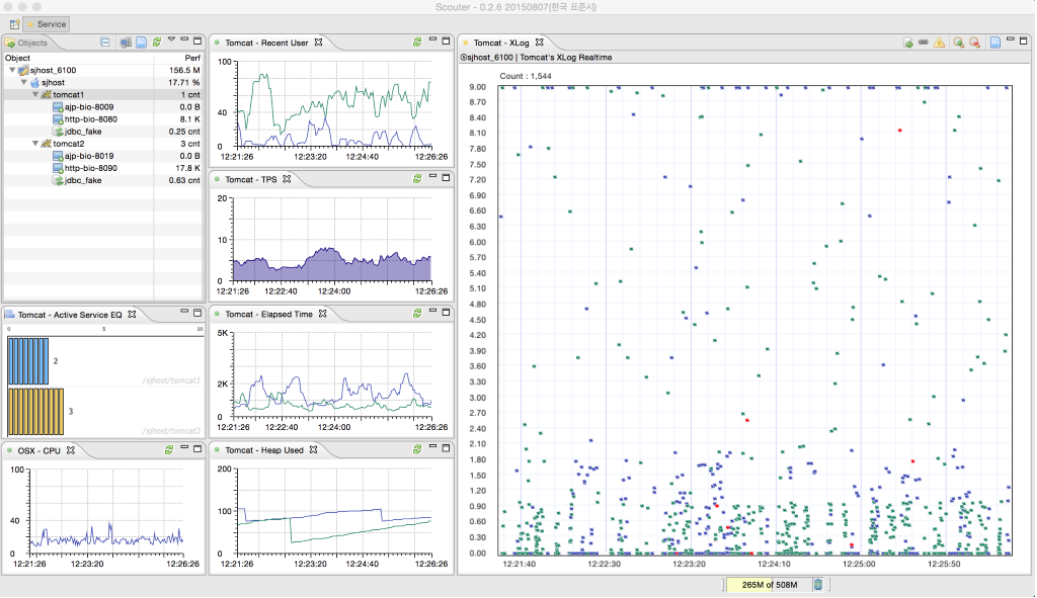
Scouter is an open-source APM tool written in Java, Javascript, and Scala. It captures active and recent users, active service, Transactions Per Second (TPS), Response time, Application profiles, CPU, Memory, Network and Heap usage, connection pools, etc.
Scouter has multiple components:
GitHub: https://github.com/AppMetrics/AppMetrics
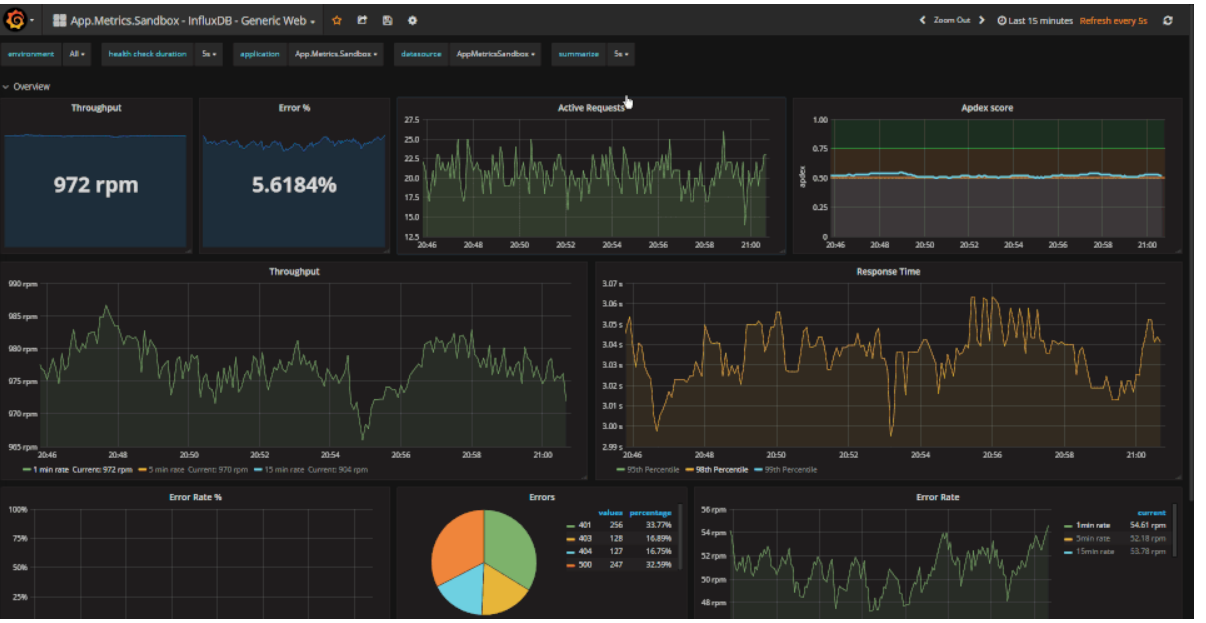
App Metrics is an open-source and cross-platform .NET library that is used to record application metrics. It can run on .NET Core or a full .NET framework supporting .NET 4.5.2. By sampling and aggregating in memory and providing extensibility points to flush metrics to a repository at a specified interval, it abstracts away the underlying metrics repository (e.g., InfluxDB, Prometheus, Graphite, Elasticsearch). It provides various metrics to measure the rate of requests, count of user logins over time, the execution time of database queries, free memory, etc.
Key features of AppMetrics:
GitHub: https://github.com/graphite-project/graphite-web
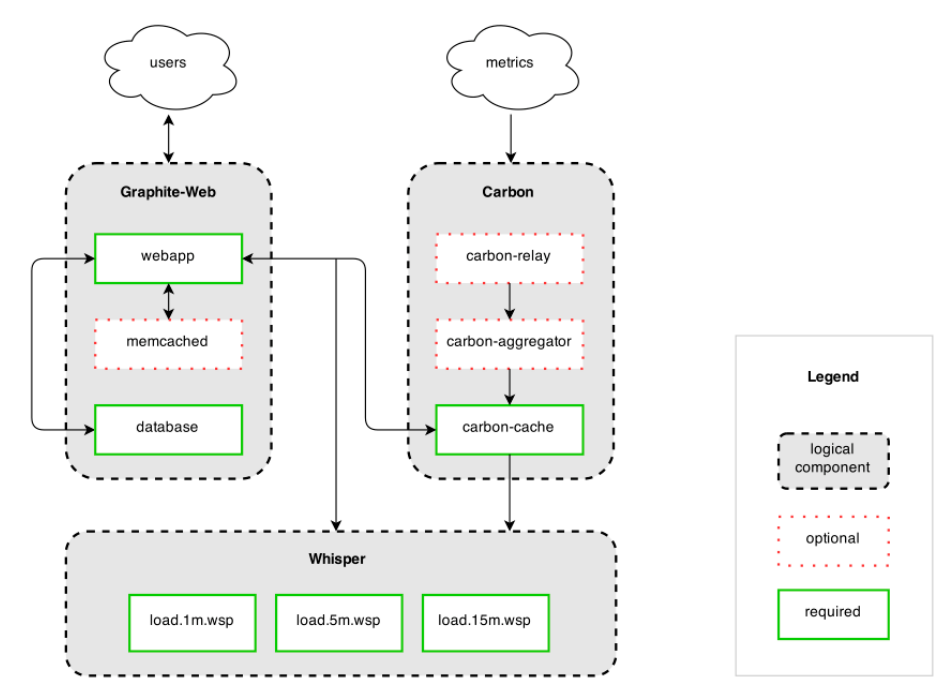
Graphite is an open-source APM tool that does not collect data but stores numeric time-series data and renders graphs on demand. With little changes to the application code, data can be sent to Graphite. Sometimes, instead of changing application code, users can leverage tools such as collectd, Collectl, telegraf, Ganglia, etc. to send data to Graphite. Graphite has a web platform that offers a variety of output styles and formats such as raw images, CSV, XML, and JSON. With this feature, anyone can easily embed custom graphs in other web pages or dashboards.
Graphite consists of three software components:
Metrics are sent to the stack via the Carbon service, which then writes the data to Whisper for long-term storage. Users interact using the Graphite Web UI or API front end, which queries Carbon and Whisper to fetch the data and show it in graphs.
GitHub: https://github.com/glowroot/glowroot
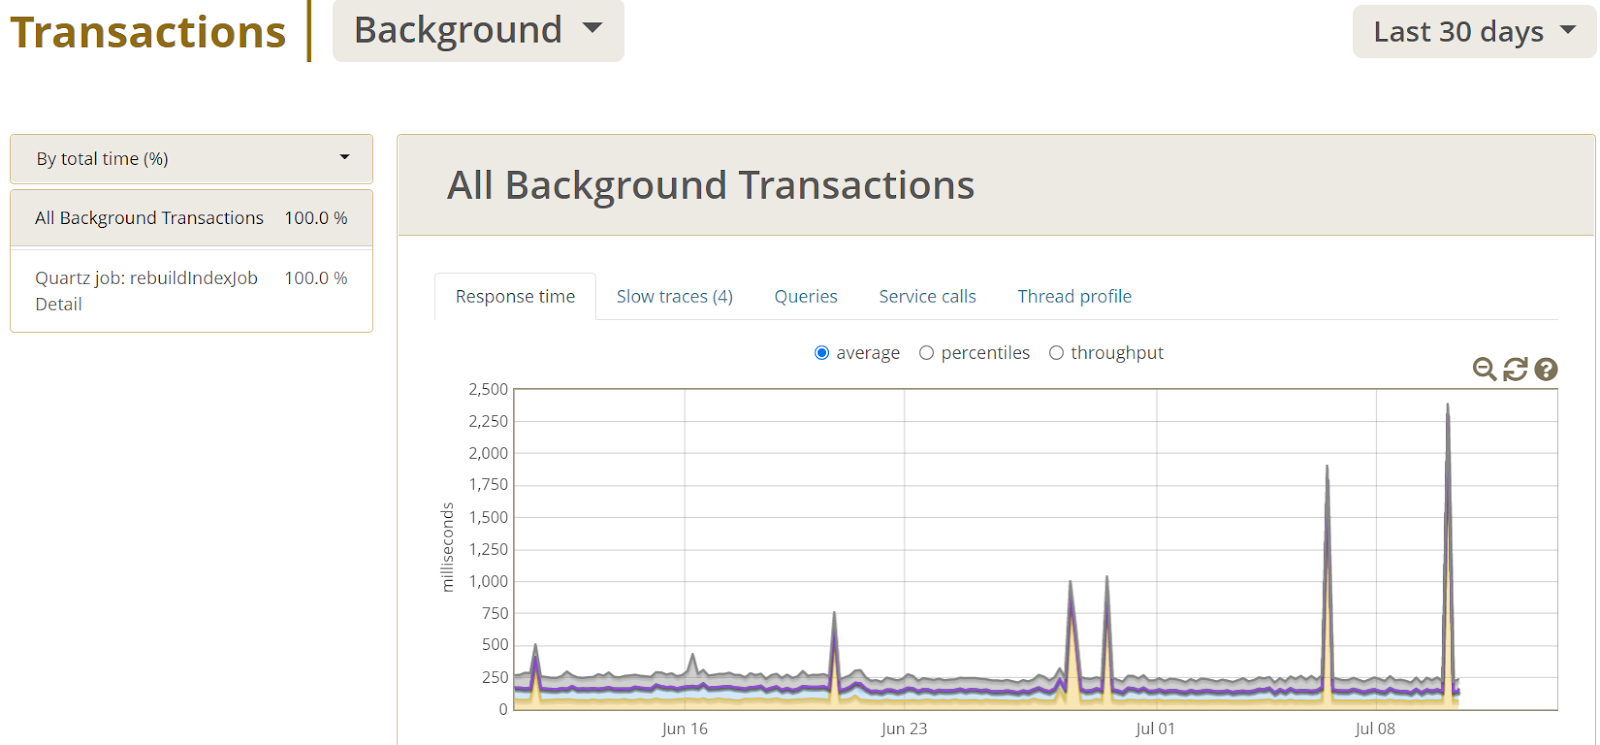
Glowroot is an open-source APM tool to monitor Java-based applications that is very easy to use. Due to extensive micro-benching and tuning of Glowroot itself, it has very low overhead, generally in the low microseconds.
Glowroot can be implemented in two ways:
Key features of Glowroot:
GitHub: https://github.com/javamelody/javamelody
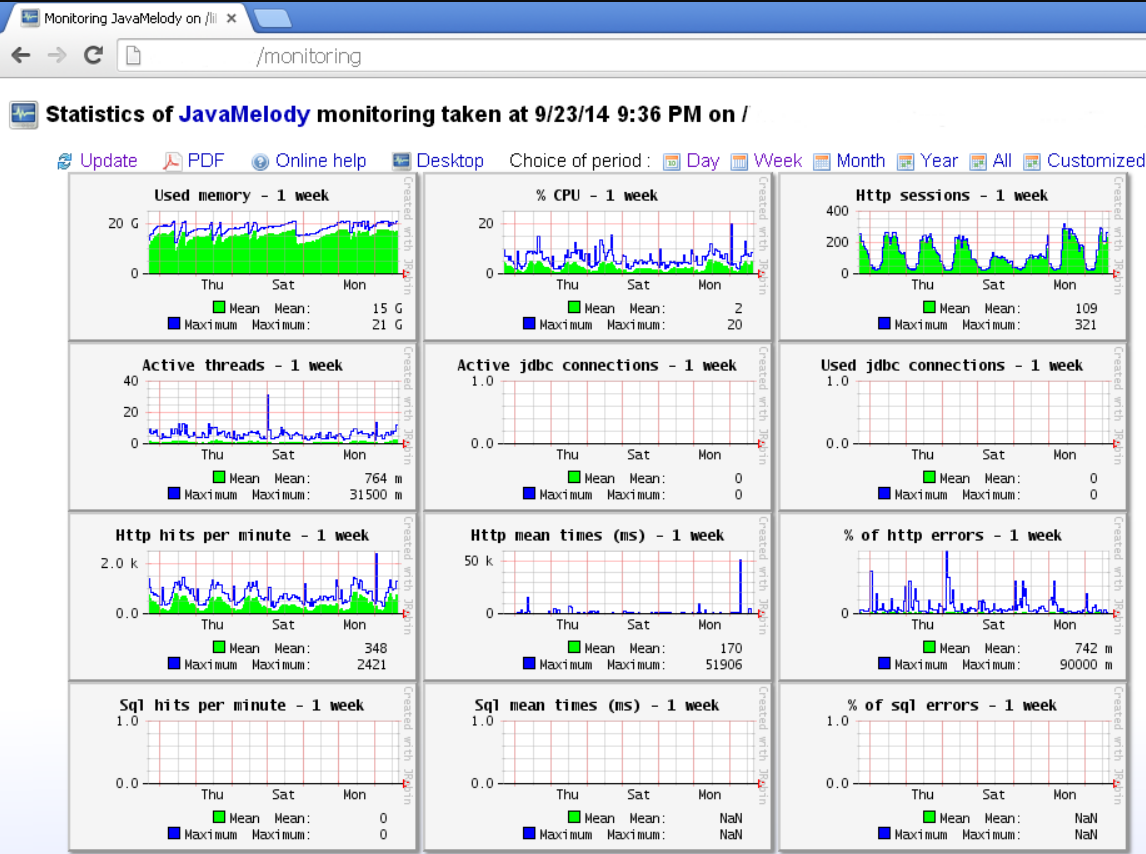
JavaMelody is an open-source APM tool that monitors Java or Java EE applications. It does not simulate user requests but measures and calculates statistics of the application based on real usage. It provides different charts or visualizations that measure execution times, memory, CPU, number of user sessions, number of JDBC connections, percentage of errors of HTTP requests, SQL requests, JSF actions, etc.
Key features of Javamelody: