
Louis-Victor Jadavji (or "LV") is a recognized leader in the cloud services industry. He's helped 50+ digital native companies like ModusBox, Later, and NS1 choose the right cloud stack for their applications. His work has been featured in Forbes (30 Under 30 All-Star), HuffPost, The New York Times, The Globe and Mail, and Inc. Magazine.
Modern-day applications are becoming more complex due to migration from a monolith architecture to microservices or applications using different languages, frameworks, serverless functions, and cloud or on-prem environments. To stay competitive, organizations are going for faster development and deployment cycles. Because of the complexity and variety of data sources, it’s now difficult to understand the root cause of problems. Application Performance Monitoring or Application Performance Management (APM) helps organizations collect, process, and visualize telemetry data from different systems and quickly find the root cause of issues.
There are many open-source and vendor-provided APM tools. Below are some of the vendor-provided APM tools.
Here are the vendors we cover (this is not an exhaustive list!):
If you want to get tips on which vendors are best-suited for common APM use cases, jump to this part.
Datadog APM provides full visibility into modern applications by monitoring, troubleshooting, and optimizing application performance, allowing you to collect and visualize both front-end and back-end data in a single pane of glass. Datadog provides multiple features such as real user monitoring (RUM) for browser and mobile devices, backend services such as tracing without limits, a continuous profiler, and many other features, including synthetic monitoring, infrastructure monitoring, network monitoring, database monitoring, CI visibility, cloud security posture management, etc.
Key features of Datadog APM and Continuous Profiler:
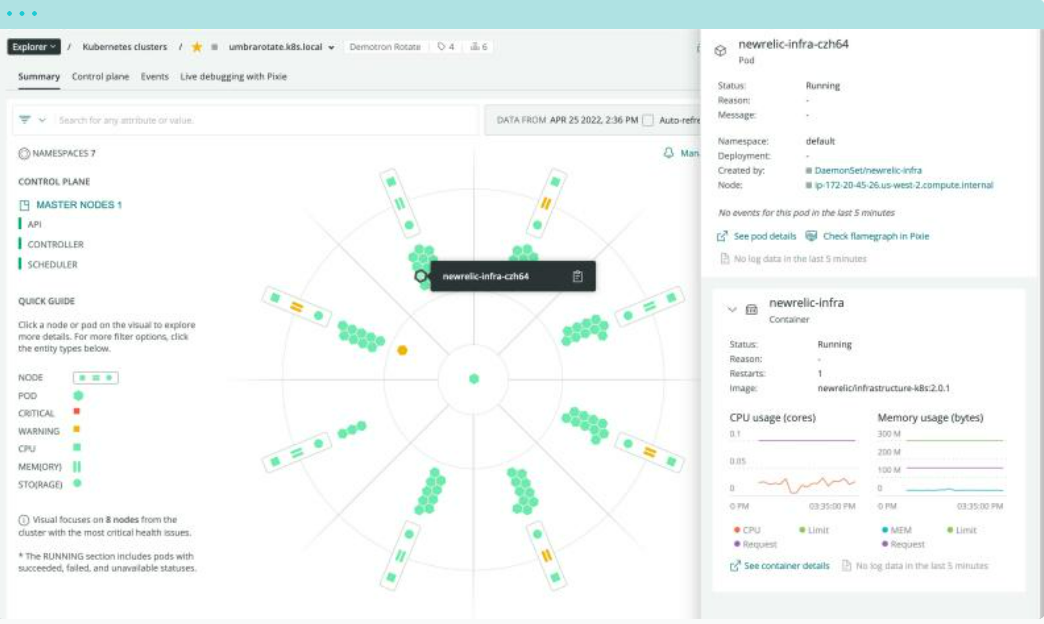
New Relic APM provides visibility into performance across the entire application environment. It has automatic instrumentation for different programming languages such as Go, PHP, Node, Python, Java, Ruby, .NET, C++, and many frameworks. It reveals transaction time, errors, and throughput in nice dashboards and has service maps that show dependencies between services so that Ops teams can see how everything works together. It captures and analyzes all traces, visualizes the most actionable data, and can catch performance changes during deployments. In addition to APM, New Relic offers infrastructure management, Kubernetes monitoring, log management, network monitoring, real user monitoring, vulnerability management, ML model performance monitoring, etc.
Key features of New Relic APM:
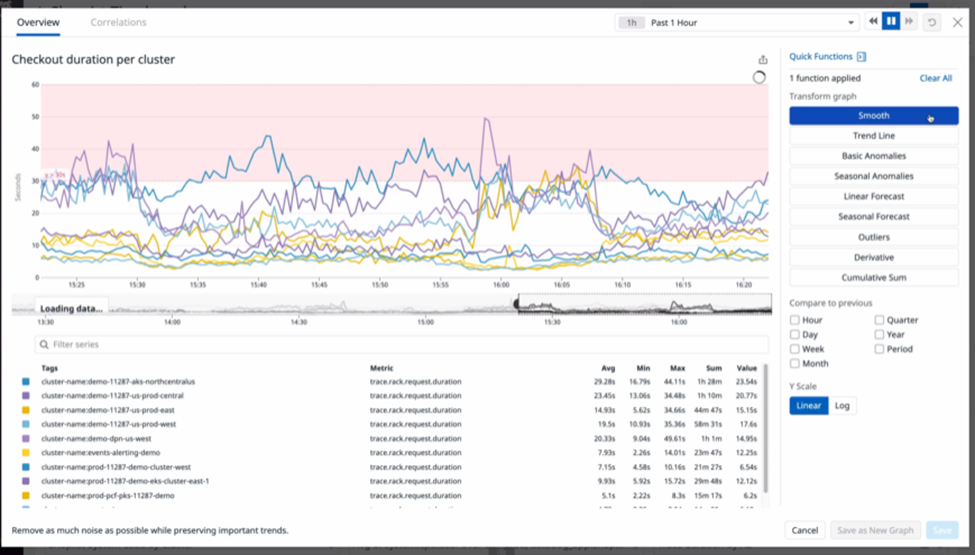
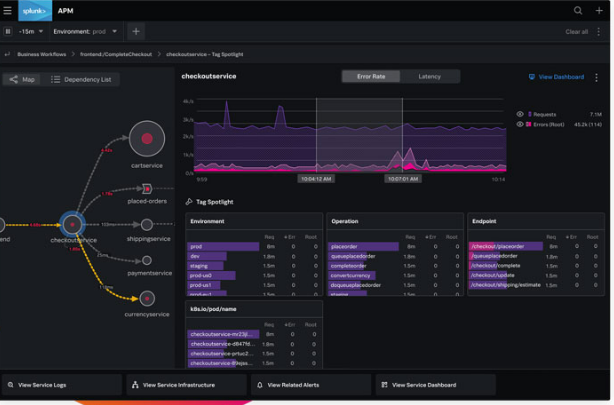
Splunk APM provides end-to-end visibility to modern organizations to pinpoint issues quickly and find the root causes. With full-fidelity tracing, it ingests and retains all the trace data to identify anomalies. AI-driven troubleshooting makes it easy to identify, scope, and resolve issues. It provides continuous code profiling that analyses code-level performance in context with trace data and minimal overhead. With Splunk APM, service bottlenecks can be identified and fixed. It also identifies resource optimization opportunities in the environment.
Key features of Splunk APM:
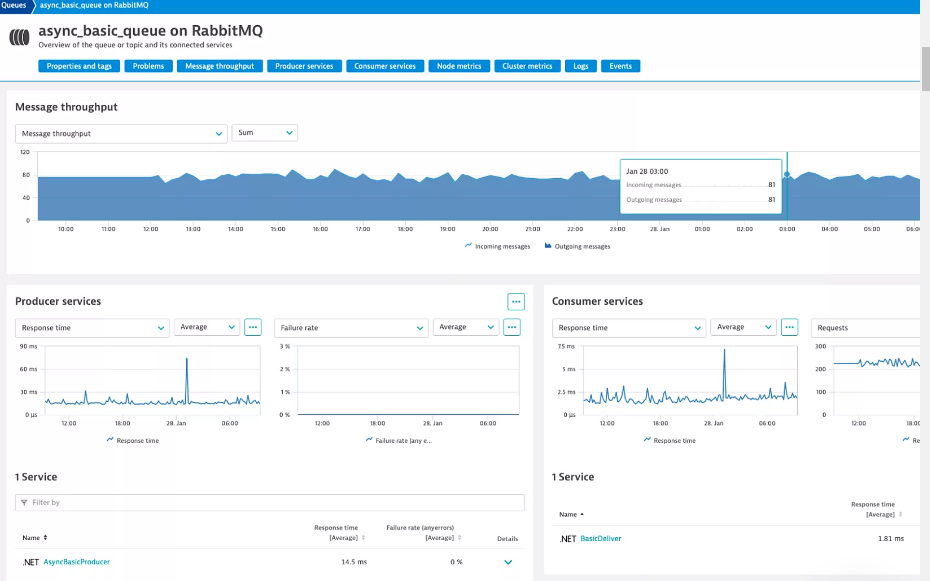
Dynatrace provides an APM that supports multiple languages, application architectures, cloud, on-premises or hybrid, enterprise applications, SaaS monitoring, etc. It provides real-time visibility into microservice-based environments and automatically discovers and monitors microservice workloads running inside containers on Kubernetes. It also provides monolith and mainframe monitoring, database monitoring, application monitoring, and many other services for end-to-end visibility.
Key features of Dynatrace APM:
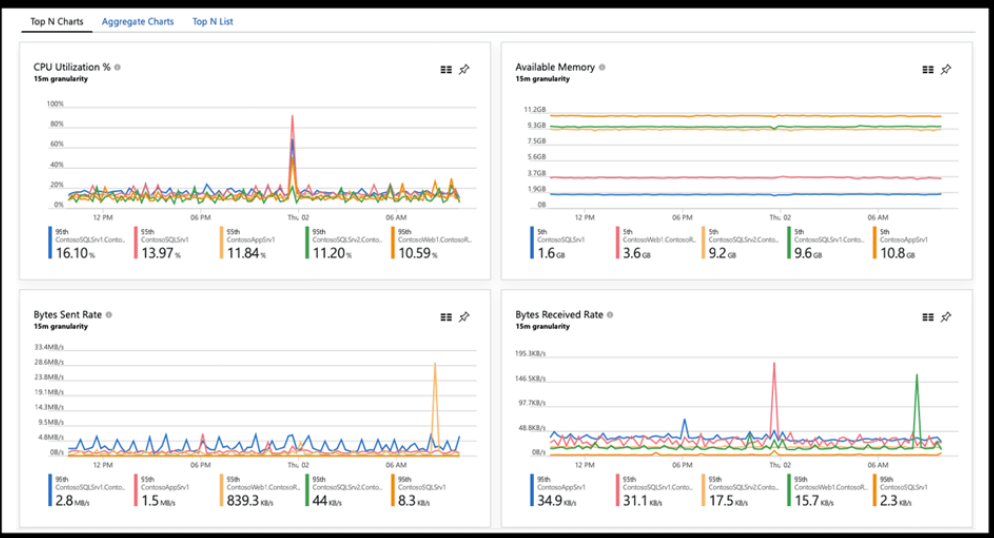
Microsoft's Application Insights is an Azure Monitor feature that provides APM-like tooling for web applications, with agents and/or SDKs for .NET, .NET Core, Java, Node.js, and JavaScript, and distributed tracing (supports OpenTelemetry). Tracing information is automatically collected by SDK dependency auto collectors for popular frameworks, libraries, and technologies.
Key features of Azure Application Insights:
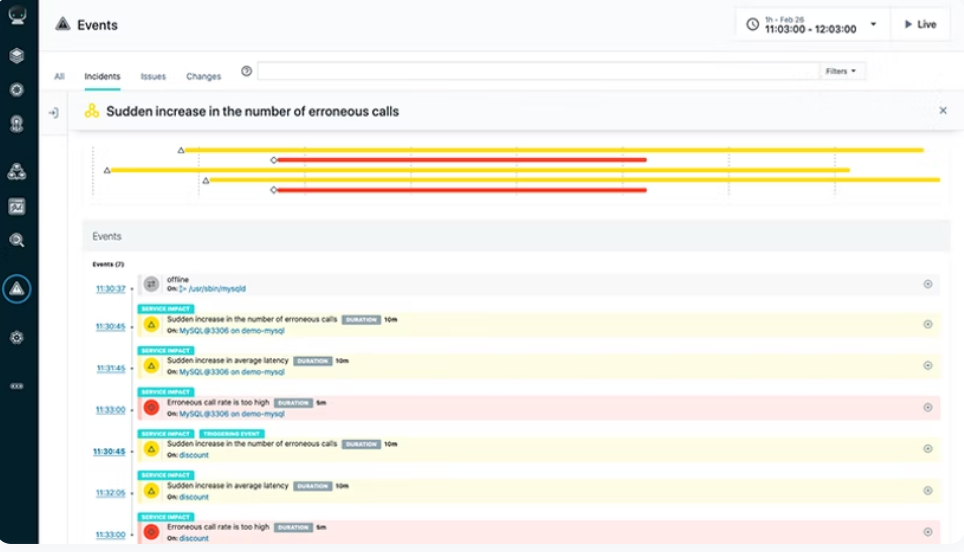
Instana is an APM that automatically and continuously discovers and maps all services and monitors all application dependencies. It traces each request, ingests metrics, profiles all processes automatically, and provides immediate contextual information about the quality of every service. It has real-time stream processing to quickly collect and analyze telemetry data and gives fast recommendations on whether to roll back or continue with the deployed changes.
Key features of Instana APM:
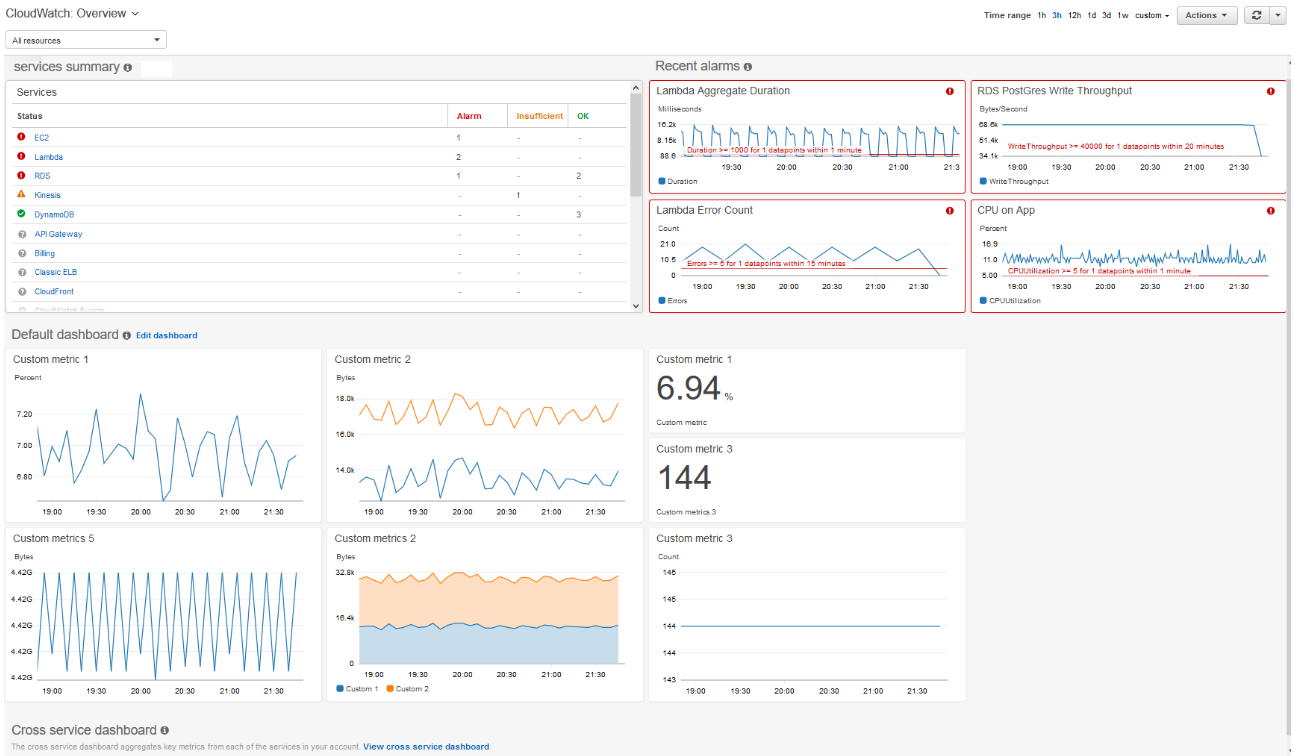
Amazon CloudWatch has an Application Insights feature that provides an automated observability setup. It helps identify and set up key metrics and logs across applications and their resources, such as databases, web servers, application servers, operating systems, load balancers, and queues. It monitors telemetry data to detect and correlate anomalies and notifies of any problems it detects.
Key features of Amazon CloudWatch:
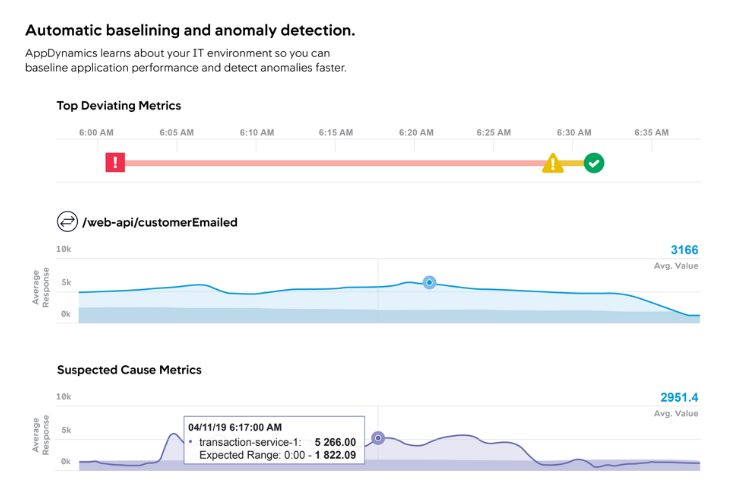
AppDynamics APM by Cisco enables management and monitoring of the application delivery ecosystem ranging from mobile/browser client network requests to backend databases/servers. AppDynamics agents send detailed performance and business metrics back to a central AppDynamics controller that automatically creates a dynamic baseline for each metric. If performance deviates from the baseline, transaction snapshots are captured down to the specific line of code.
Key features of AppDynamics:
With the onslaught of new vendors and features to consider, how do you vet and choose the right APM vendor for you? Below, we break down how some vendors fit in with common APM and observability use cases.
Need to monitor a complex hybrid environment (or even exclusively on-premises)? Maybe you also expect a sales cycle and customer support package best-suited for enterprise. In such cases, your best options are:
Dynatrace is better if you also have lots of microservices or serverless running your applications, whereas AppDynamics might have more powerful tools for understanding the end-to-end user journey.
If you are a cloud-native technology company that has scaled-up or are scaling up rapidly (e.g., a "unicorn"), the simple answer is to go with Datadog nearly every time. You might want to consider other options if you are sensitive to cost.
SolarWinds APM does not offer nearly the amount of features as other APMs, but it does offer a very simple and affordable pricing structure that is suitable for small environments. Alternatively, New Relic is also free if you keep the amount of data ingested per month to under 100 GB.
Amazon CloudWatch usually does the trick if you don't have any (or very little) 3rd party services or other cloud providers in the mix.

