
Louis-Victor Jadavji (or "LV") is a recognized leader in the cloud services industry. He's helped 50+ digital native companies like ModusBox, Later, and NS1 choose the right cloud stack for their applications. His work has been featured in Forbes (30 Under 30 All-Star), HuffPost, The New York Times, The Globe and Mail, and Inc. Magazine.
Modern-day applications are increasingly complex due to the shift from monolith architectures to microservice-based architectures or applications using different languages, frameworks, and serverless functions. Understanding whether an APM is enough, or whether a full-fledged Observability platform is more suitable is highly dependent on your use case.
This resource covers the following topics:
Because of the complexity and sheer variety of data sources, finding the root cause of problems in an application or infrastructure is challenging. Application Performance Monitoring — also called Application Performance Management, or APM for short — helps organizations collect, process, and visualize the telemetry data from different systems and quickly find the issue.
Here are some common limitations of APM tools:
To ensure that systems support a good customer experience while changes are being deployed, organizations are trying different types of monitoring, like database monitoring, infrastructure monitoring, network monitoring, etc., to collect different telemetry data such as metrics, logs, and traces, to understand the complete system.
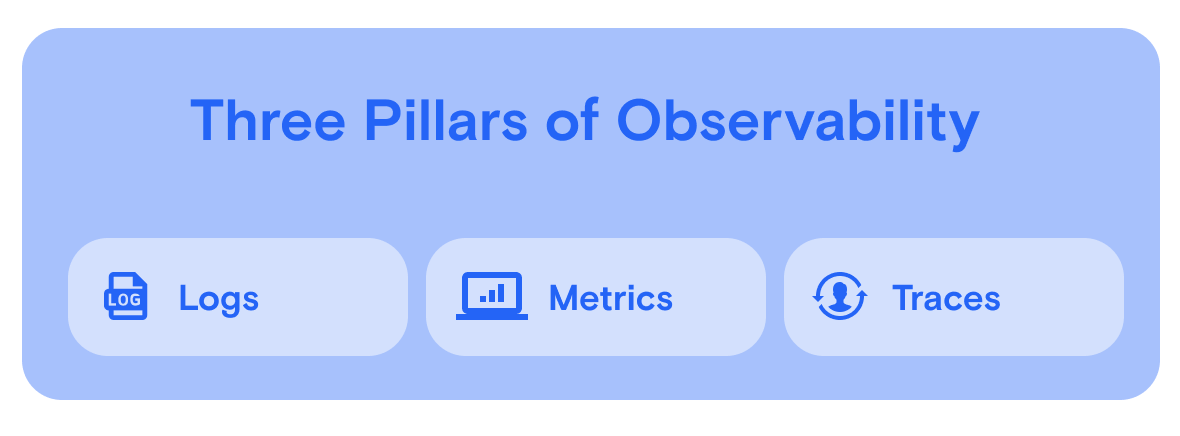
APM tools help organizations automate the above-mentioned process of detecting issues when they happen (i.e., a high-level picture), whereas Observability helps answer why an issue occurs and provides more granular telemetry data. Logs, metrics, and traces are the three pillars of Observability.
Metrics, logs, and traces are called the “Three Pillars of Observability” and are collected to make the system observable.
While the terms Monitoring and Observability are often used interchangeably, there are some key differences.
If you have a simple monolithic architecture, Monitoring should be enough. Whereas if you have a complex architecture with multiple processes running on several machines, Observability can provide a more coherent view of the combined (i.e., correlated) telemetry data.
Monitoring has more of a reactive approach, whereas Observability has more of a proactive approach. With Monitoring, you define the thresholds/SLOs/SLAs, and you get alerted when something goes exceeds them. You may be able to deploy a quick fix with the help of APM tools. With Observability, you can make your system stable and reliable by understanding the state of the system and by avoiding failures. This helps achieve higher standards of operational excellence and supports a better end-user experience.
Monitoring is more about collecting data, whereas Observability focuses on interpreting the data. Monitoring instruments Observability; you need monitoring to make a system observable. Observability not only collects the data from different heterogeneous data sources but also correlates the data and identifies relevant patterns or anomalies within the data.
With monitoring tools, Ops teams usually collect metrics and logs from the systems they know and define thresholds based on their experience. As a result, the reports or dashboards reveal only anticipated performance issues or abnormalities (i.e., known-knowns).
On the other hand, Observability collects logs, traces, and metrics across all the systems or services in the organization and proactively notifies Ops teams about potential issues. This helps Ops teams debug their systems faster and make them reliable. They can also identify any vulnerabilities or bugs in the system before attacks or issues occur based on the relevant patterns and abnormalities of the telemetry data.
With Monitoring, you get alerts when something goes wrong. This is the “What” of the issue. Observability helps you answer “Why” there’s a problem and how to fix it. For example, if you get an alert from your APM tool that latency is too high, then you need Observability to find out which specific service is causing that issue. From there, you can work on fixing the problematic code or service, thereby improving latency.
Application Performance Monitoring (APM) is important to reduce the burden Ops deals with, equipping them with better reports/visualizations for debugging, reducing downtime, providing faster response times for applications, and helping speed up new feature deployment.
Without APM tools, Ops teams take considerable time to debug using the log data. And worse yet, when there isn’t enough visibility, these teams can waste time and resources guessing what the underlying issues are.
With the continuing trend of adoption of microservice-based architectures, the use of both cloud and on-prem data centers, open source and vendor-provided tools, different languages, frameworks, and serverless functions, it is important to have an APM tool to monitor and quickly respond to any issues. However, if your system is highly distributed and complex, APM is probably not enough.
System reliability is critical in this ultra-competitive business world. In organizations with complex and distributed architectures, multiple vendors, containerized applications, hybrid cloud (having both on-prem and cloud), multiple frameworks, languages, etc., it's not easy to understand the dependencies without making the system fully observable. In such cases, it’s necessary to collect, process, and analyze the telemetry data such as logs, traces, and metrics, correlate them, and truly understand the system's state. Observability helps organizations achieve higher standards for operational excellence and keep the systems reliable.

