
Louis-Victor Jadavji (or "LV") is a recognized leader in the cloud services industry. He's helped 50+ digital native companies like ModusBox, Later, and NS1 choose the right cloud stack for their applications. His work has been featured in Forbes (30 Under 30 All-Star), HuffPost, The New York Times, The Globe and Mail, and Inc. Magazine.
Observability is an end-to-end framework for collecting telemetry data — logs, traces, metrics, and events — at the infrastructure and application levels for analysis and visualization.
Observability is essential to achieving the higher standards for operational excellence expected of software and Ops teams today. Development and deployment speed is critical for most organizations, as well as quick resolutions to any issues that cause downtime, so many organizations have opted for agile development frameworks, CI/CD, and microservices-based architecture. However, there is a tradeoff: we’re now dealing with more complex systems.
As systems become more complex, Ops teams should have the tools to collect, process, analyze, and visualize real-time data from different systems to quickly identify any issues and their root causes, and reduce downtime for end-users. APM (Application Performance Monitoring or Application Performance Management) is a somewhat legacy approach that provides high-level information for the Ops team. In contrast, Observability provides the drill-down and high cardinality necessary for solving issues in complex distributed architectures. Monitoring remains essential in Observability.
This resource covers the following topics:
To make a system “observable,” you need telemetry data from all system components. Telemetry data comprises logs, traces, and metrics but sometimes includes other things. These three are oft-called the “Pillars of Observability.”
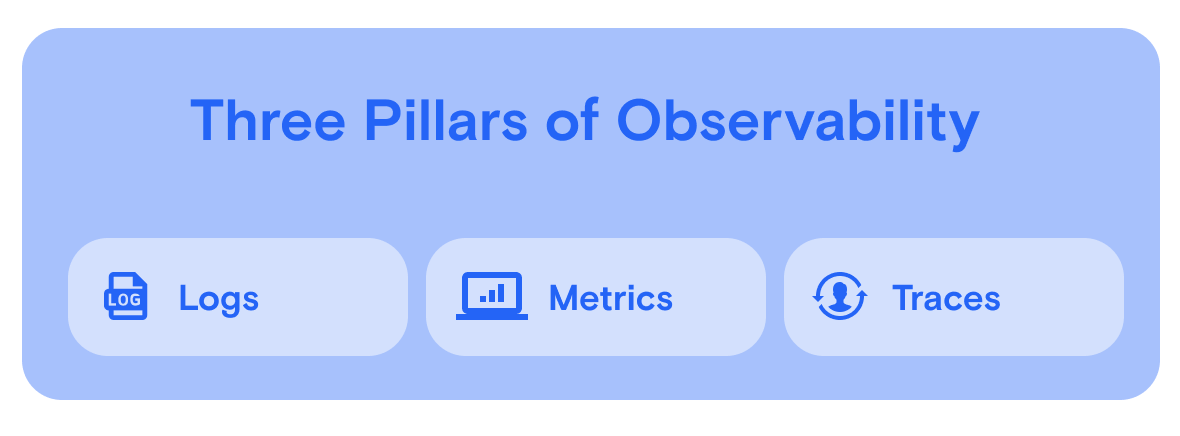
Logs are events recorded by different infrastructure and application system components that help developers go back in time to troubleshoot any issues. How logs are instrumented, their history retention and their granularity level are important decisions development teams have to make.
Here’s some further detail on logs:
Metrics help you understand the overall health of the system. Thresholds for alerting and proactive monitoring can be defined for each metric — like CPU usage, memory usage, load average, network in, network out, and latency.
For every request made by a user or application, traces shine a light on the end-to-end workflow, entire request lifecycle, or user journey. Generally, having tracing tools provide full visibility of the software development process is a good thing.
Here’s some further detail on traces:
Collecting, processing, analyzing, and visualizing telemetry data from complex systems and applications in observability tools helps Ops teams respond faster to incidents, understand root causes, and prevent future issues.
Using observability tools with real-time monitoring enabled, Ops teams can analyze telemetry data to respond to any performance degradation before users are impacted.
The reliability of a system becomes better with observability. Proactive monitoring helps reduce downtime and increases Ops team responsiveness.
With the help of observability tools — which can identify security threats, attacks, and data leaks — security teams have more visibility into the security landscape of their organization.
With Observability tools, Ops teams can find issues and their root cause faster with the highly granular data available. It also gives Ops teams a better chance at permanently fixing issues rather than just looking for a temporary fix in the panic of the moment.
How is Observability implemented?
To implement Observability, organizations should follow these steps:
Traditional monitoring of applications or services is not enough in the current world of complex and distributed architectures, countless vendors, and containerized applications. Implementing Observability is needed as organizations are going for faster deployments to increase revenue and expect reliable systems and applications for a better end-user experience.
With complex architectures, countless vendors, and multiple tools, organizations often run into different challenges with Observability.
Sometimes, so much data is generated that it takes too long and too many resources to collect, store and analyze it. Regularly eliminating unwanted data and finding important and relevant data is critical for faster debugging.
Manual instrumentation takes up a lot of time and effort. If data is not collected from all the systems in the architecture, then you’re likely to miss some important pieces when conducting an analysis to understand the root cause of an issue. Ops teams that end up doing too much guesswork with the limited data available to them will consume much more of their time in the debugging process.
Telemetry data from different tools can come in different formats, and that adds complexity when trying to run correlations and analyses from the data.
Collecting, processing, and analyzing data in real-time is important for critical applications where downtime is a bigger deal.
To overcome these challenges different Observability tools are available. It’s a busy market, so there are many open source and third-party vendors to choose from, which means you might take longer than you’d like to pick the right one for your use case. If you need help with this, try our free tool to find the best Observability product for your specific use case.

